Energy trades and demands in Europe and its Neighbourhoods
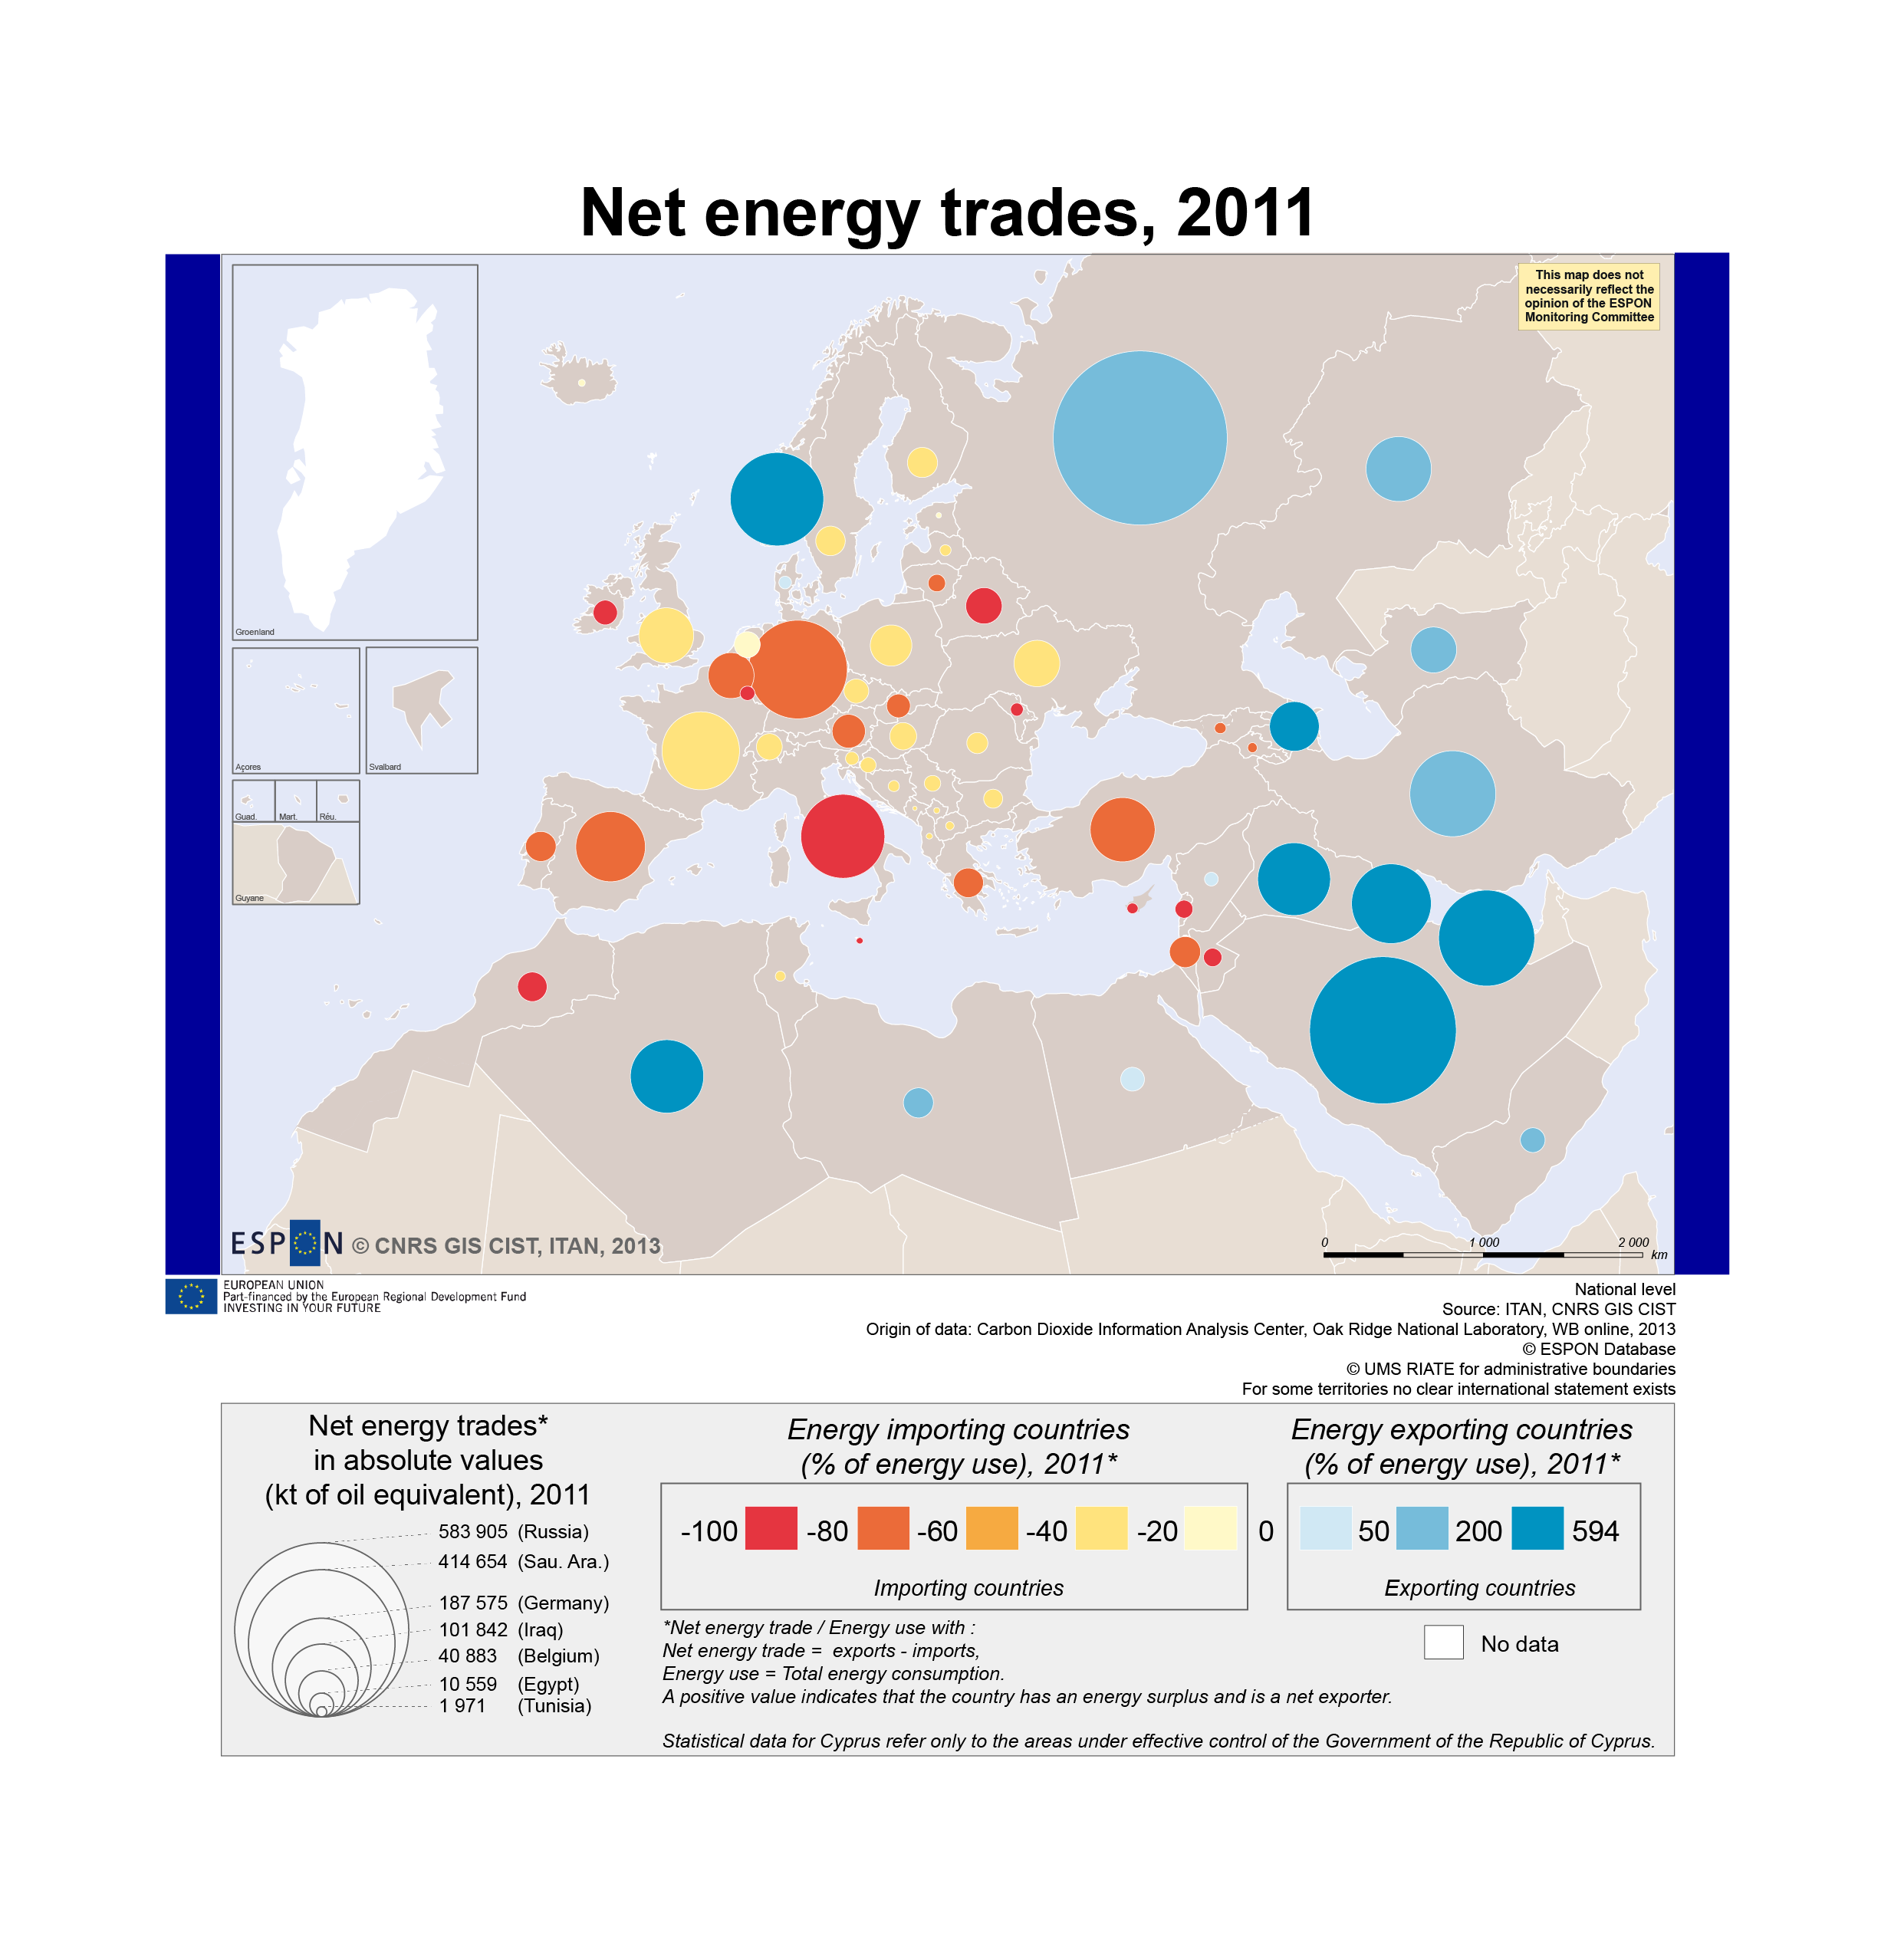


Net energy trades, 2011 (left image);
Demographic evolution, 2000-2010 (centre image);
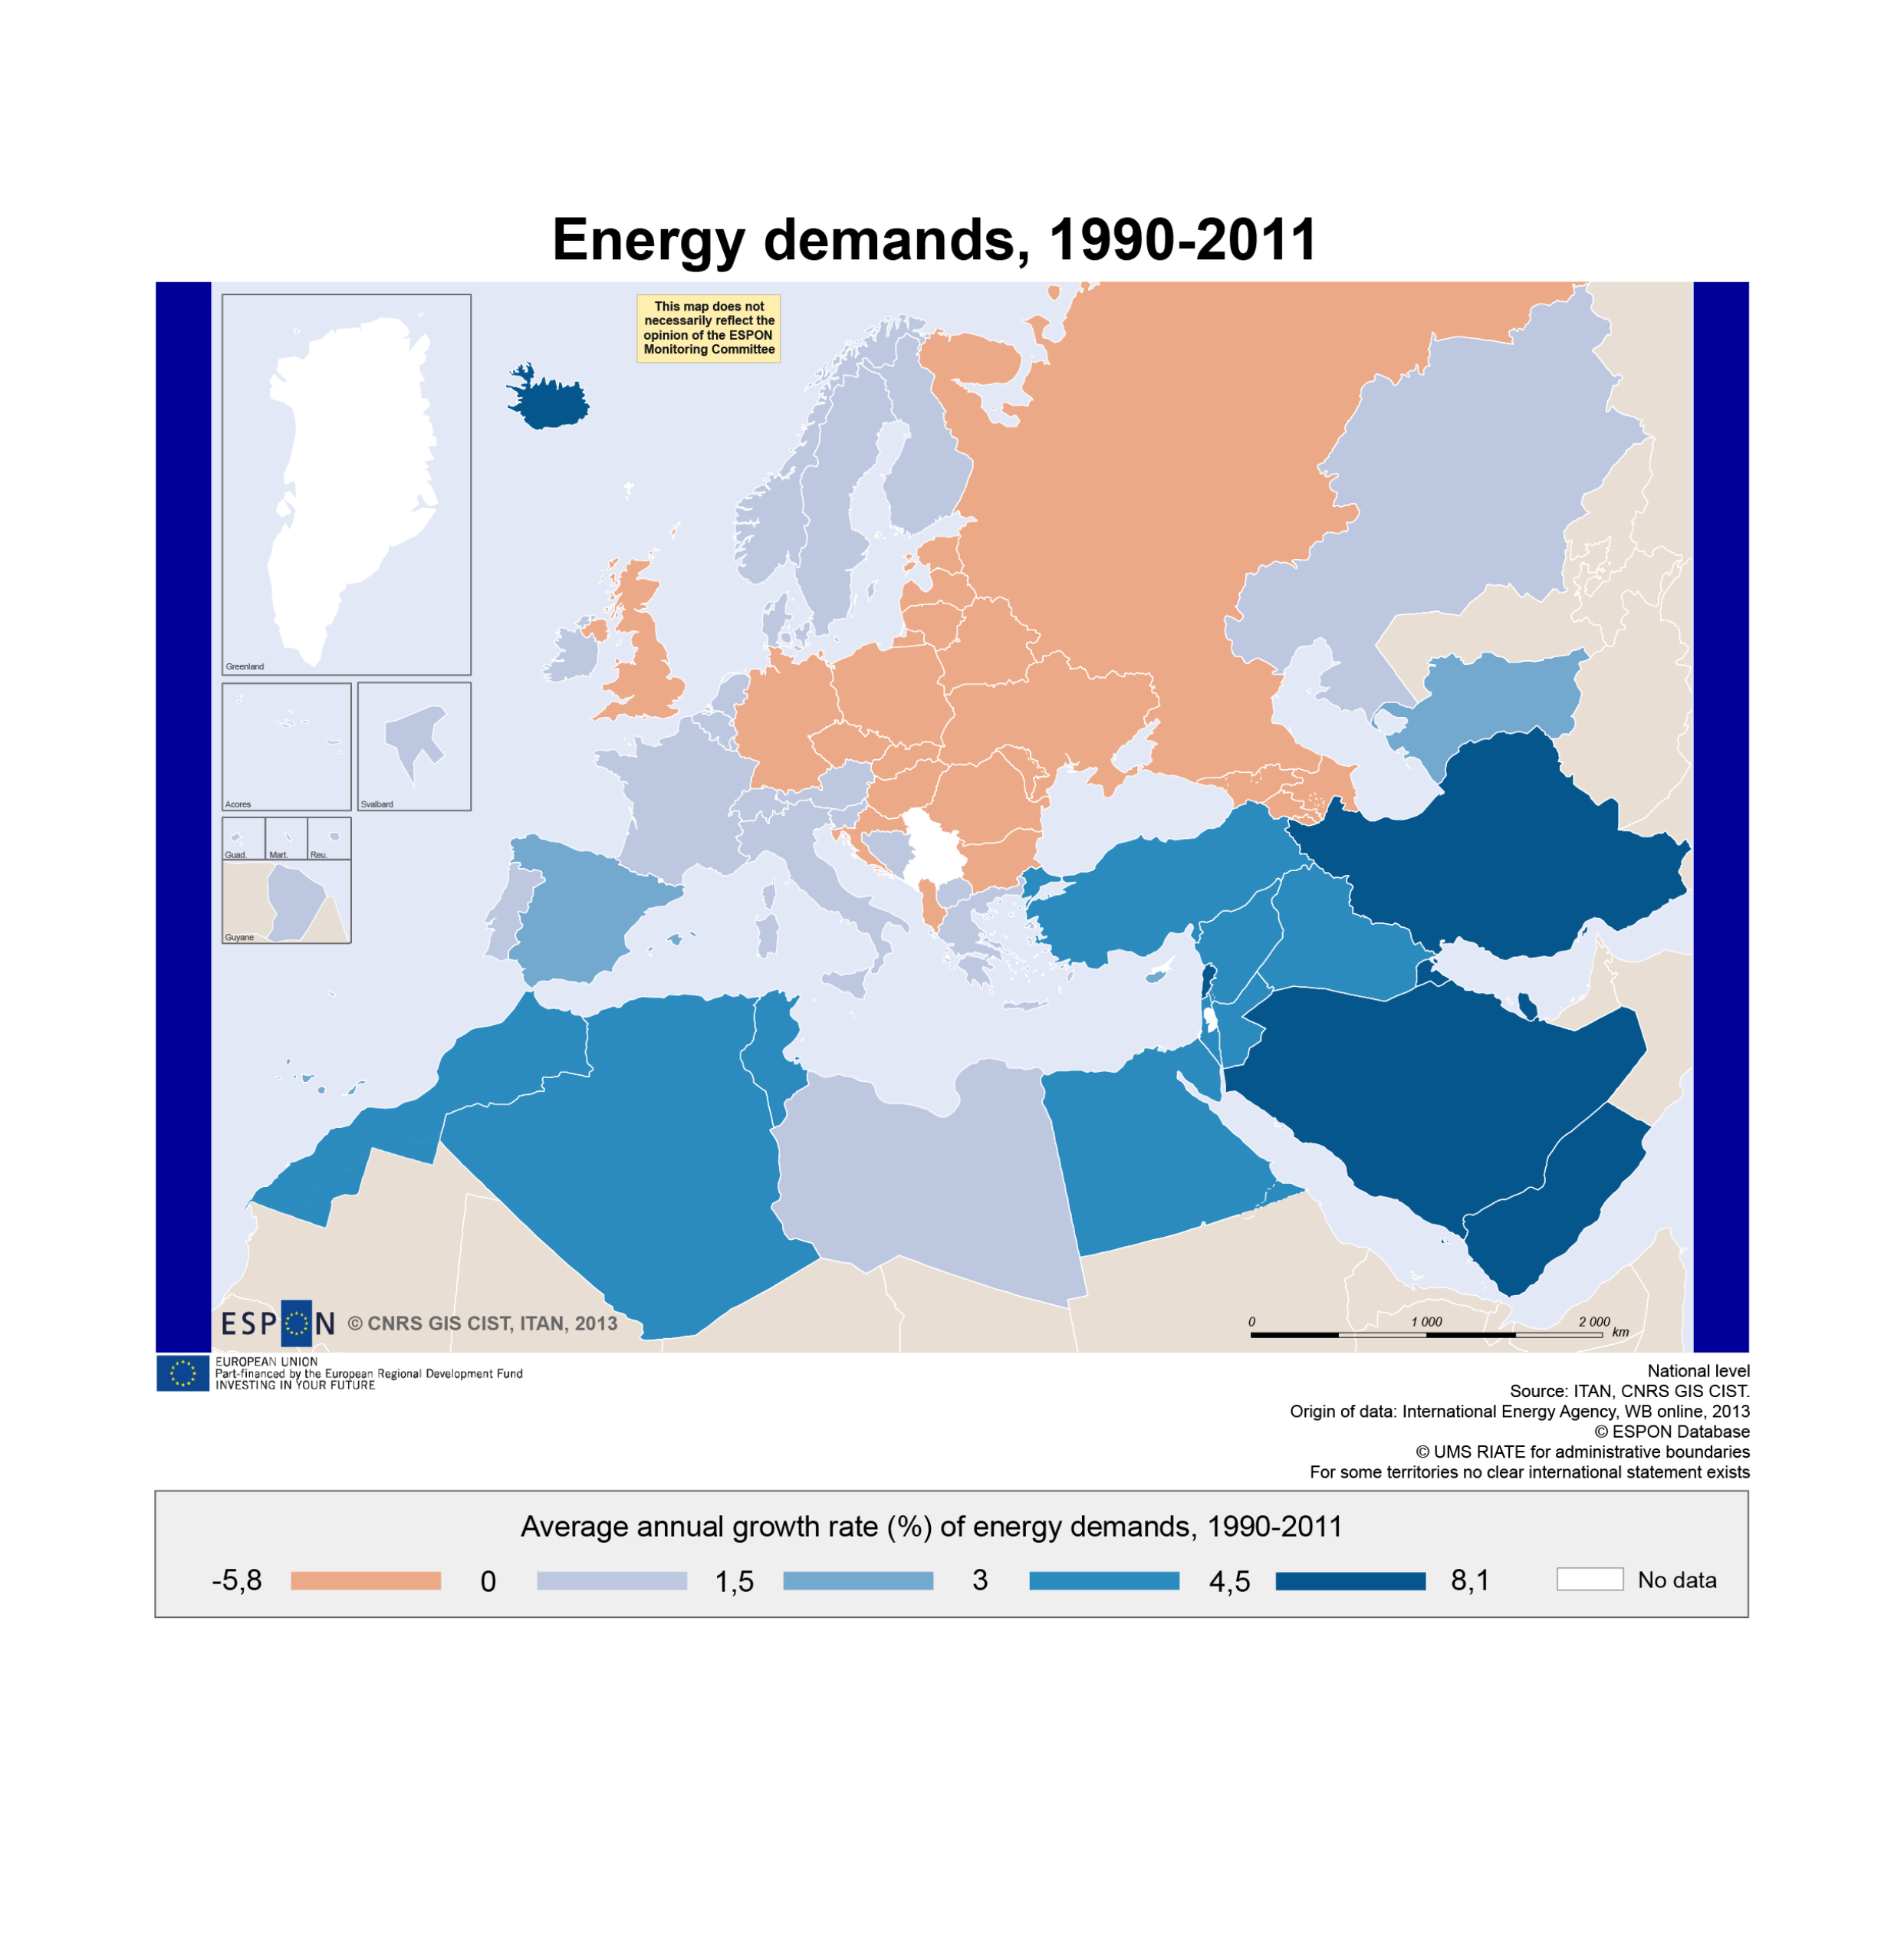
Energy demands, 1990-2011 (right image)
Policy context
Cooperation with the neighbouring countries has long been an important objective for the European Union. The increase of regional integration in America and eastern Asia, the Arab Spring and the European need for expanding markets since the beginning of the financial crisis, have made wider cooperation still more relevant. A large set of EU policies establish a favourable context for European actions dedicated to the European neighbour countries, also in territorial terms.
In the Europe 2020 Strategy, the neighbourhood dimension is present in both the “Agenda for new skills and jobs” and “An industrial policy for the globalisation era” which speaks of EU’s “particular interest in seeking closer economic integration with neighbouring countries through the European Neighbourhood Policy”. Furthermore, EU Cohesion Policy promotes cross-border and transnational cooperation as well as macro-regions, including neighbouring countries, by encouraging economic activity and territorial development across internal and external EU borders.
For European actors, the neighbourhoods constitute market opportunities because of their demographic and economic size, which are rising in particular in the Mediterranean Neighbourhood. However, European trade and investment there is currently low and declining, even though several neighbourhood countries possess substantial natural resources, namely energy.
Most EU countries consume high levels of energy (EU’s energy dependency is envisaged to reach 65% by 2025 and up to 80% for gas). The EU neighbouring countries hold at the same time a large amount of the world’s energy resources:
- The Eastern Neighbourhood has an impressive part of potential resources: Russia alone is equipped with 32% of world proven natural gas reserves, 12% of the proven oil reserves and 10% of the explored coal reserves. It procures a third of the hydrocarbons imported by Europe and a quarter of its coal imports.
- Mediterranean Neighbours possess 5% of the world’s oil resources and 3% of its gas. They supply a third of the gas and a quarter of the oil consumed in Europe. Production and transit countries are similarly dependent on European markets, with 70% of North Africa’s oil exports and 90% of its gas exports being sent to Europe.
Energy collaboration in the European neighbourhood is therefore strategic for Europe, in ensuring energy supply but also as basis for industrial, social (employment) and environmental partnerships. Though, future promising policy developments and decisions in this respect have to be aware of the remarkable demographic trends taking place.
Observations
The map “Net energy trades, 2011” reveals a striking complementarity between Europe and its neighbours with energy trade deficits in Europe (except Norway) and trade surpluses in many of the neighbourhood countries. However, some neighbours are also net importers of energy, such as Morocco, Turkey and Ukraine.
Future patterns of energy consumption, and accordingly energy demands and surpluses of Europe and its neighbours, will be also influenced by demographic changes. The map “Demographic evolution, 2000-2010” displays different tendencies from positive demographic growth in the westernmost Europe to a mixed situation in Germany and a decline when moving towards the external borders eastwards. The demographic decline of almost all the Balkans and Eastern Neighbourhood countries is observable, being most severe in northernmost regions of Russia, several oblasts in central Russia as well as in some regions of Ukraine. This development is likely to contribute to declining energy consumption in some regions, even though demography is of course not the only relevant factor in this respect.
An increase in population can be observed in the capital regions as St. Petersburg city and Leningrad oblast. This coincides with the trend occurring in the majority of the EU countries. A population increase can be also noticed in the south-eastern regions and the Nordic countries including Iceland and Norway. A significant drop in population in the three Baltic States as well as Poland, Romania and Bulgaria is visible. The Mediterranean Neighbourhood countries have a growing population with some exceptions. In Turkey for example considerable demographic changes are taking place. The country shows regions growing in population and others shrinking. Again, these trends will influence the demand for energy.
Against this backdrop a related development as shown for the demographic evolution can be already noticed when it comes to “Energy demands 1990-2011”, identifying a link between these factors. A decline is apparent for the Eastern Neighbourhood with the strongest decrease in Armenia, Georgia and Moldova. A huge rise of the energy demand, though, can be seen in the Southern Neighbourhoods, which will also impact future energy trades towards Europe. Within the EU the strongest decline is visible in Estonia, Latvia and Lithuania.
Points for Policy consideration
In the coming decades a substantial rise of the energy demand is expected in the Southern Neighbourhoods. The Mediterranean Neighbourhood is Europe’s largest with 285 million inhabitants. The predictions point at very substantial demographic growth. Already in 2025 the population number could be around 340 million. This means at the same time substantial potential markets for European energy enterprises, which could find opportunities in markets and labour, if current political instability in some of the countries can be overcome. However, an energy boom in these neighbourhoods is also a threat, if it is managed with low energy efficiency and high greenhouse gas emissions.
Furthermore, the decrease in energy demands in the Eastern Neighbourhood will contribute to rising potentials for energy exports from these countries. Also this development will impact the future energy market of the EU.
Against this backdrop the key advantages in an in-depth cooperation with the European neighbour countries in the field of energy seem to be the security of procurements and a common policy in favour of the energy transition towards better energy efficiency and lower levels of emissions.
Furthermore, energy has other strong territorial dimensions such as local access to electricity, solar electricity for remote areas, energy saving by compact sustainable urbanism as well as cross-border cooperation thanks to shared energy transport facilities.
Concept/method/measurement
The ITAN project covers the following neighbourhood countries:
- Northern Neighbourhood: Faroe Islands and Greenland (both of which are independent Danish territories) and North-Western Russia (also part of the Eastern Neighbourhood);
- Eastern Neighbourhood: Ukraine, Belarus, Moldova, Russia (to the Ural Mountains), Georgia, Armenia and Azerbaijan;
- South-Eastern Neighbourhood: Croatia , Bosnia-Herzegovina, Serbia, Montenegro, Kosovo (under the UN Security Council resolution 1244/99), The former Yugoslav Republic of Macedonia and Albania;
- Southern/Mediterranean Neighbourhood: Morocco, Algeria, Tunisia, Libya, Egypt, Jordan, the occupied Palestinian territory, Israel, Lebanon, Syria and Turkey.
Net energy trades, depicted in the map by the size of the circles, demonstrate absolute values in kilotons of oil equivalent. This indicator is calculated by subtracting energy imports of one country from energy exports of the same country. The energy use, depicted by the colour of circles, presents the percentage of total energy consumption of a country. A positive value (blue colour) indicates that a country has an energy surplus, being a net exporter. While a negative value (from red to yellow colour) represents energy importing countries.
For the demographic evolution the annual growth rate of population, displayed in percentages, has been used. For each region available data closest to the year 2000 and 2010 has been utilized for this calculation.
The map on the energy demands displays the percentage of the average annual growth within an eleven year time span.
More information
- This Map of the Month is a result of the ESPON Applied Research "ITAN - Integrated Territorial Analysis of the Neighbourhood"
- Contact at the ESPON Coordination Unit: Ann-Gritt NEUSE ([email protected])
Documents

|
Map of the Month "Energy trades and demands in Europe and its Neighbourhoods"
|
|

|
Map "Net energy trades, 2011"
|
|

|
Map "Demographic evolution, 2000-2010"
|
|
|
Map "Energy demands, 1990-2011"
|

