Attractiveness of Regions to Migrants and Visitors
The attractiveness of Europe and its regions and cities is a theme of the Europe 2020 strategy and Territorial Agenda. Territorial assets and the quality of places are important dimensions of many regional development strategies within a globalising and interconnected world. Competition has intensified and financial resources become increasingly footloose(1). Consequently the capacity to attract these footloose resources that include human capital has become an increasingly important aspect of regional development.
This month ESPON presents a map on the attractiveness of European regions to migrants and visitors from the ESPON Applied Research project ATTREG. For the first time in the Map of the Month series, data is presented for Turkey.
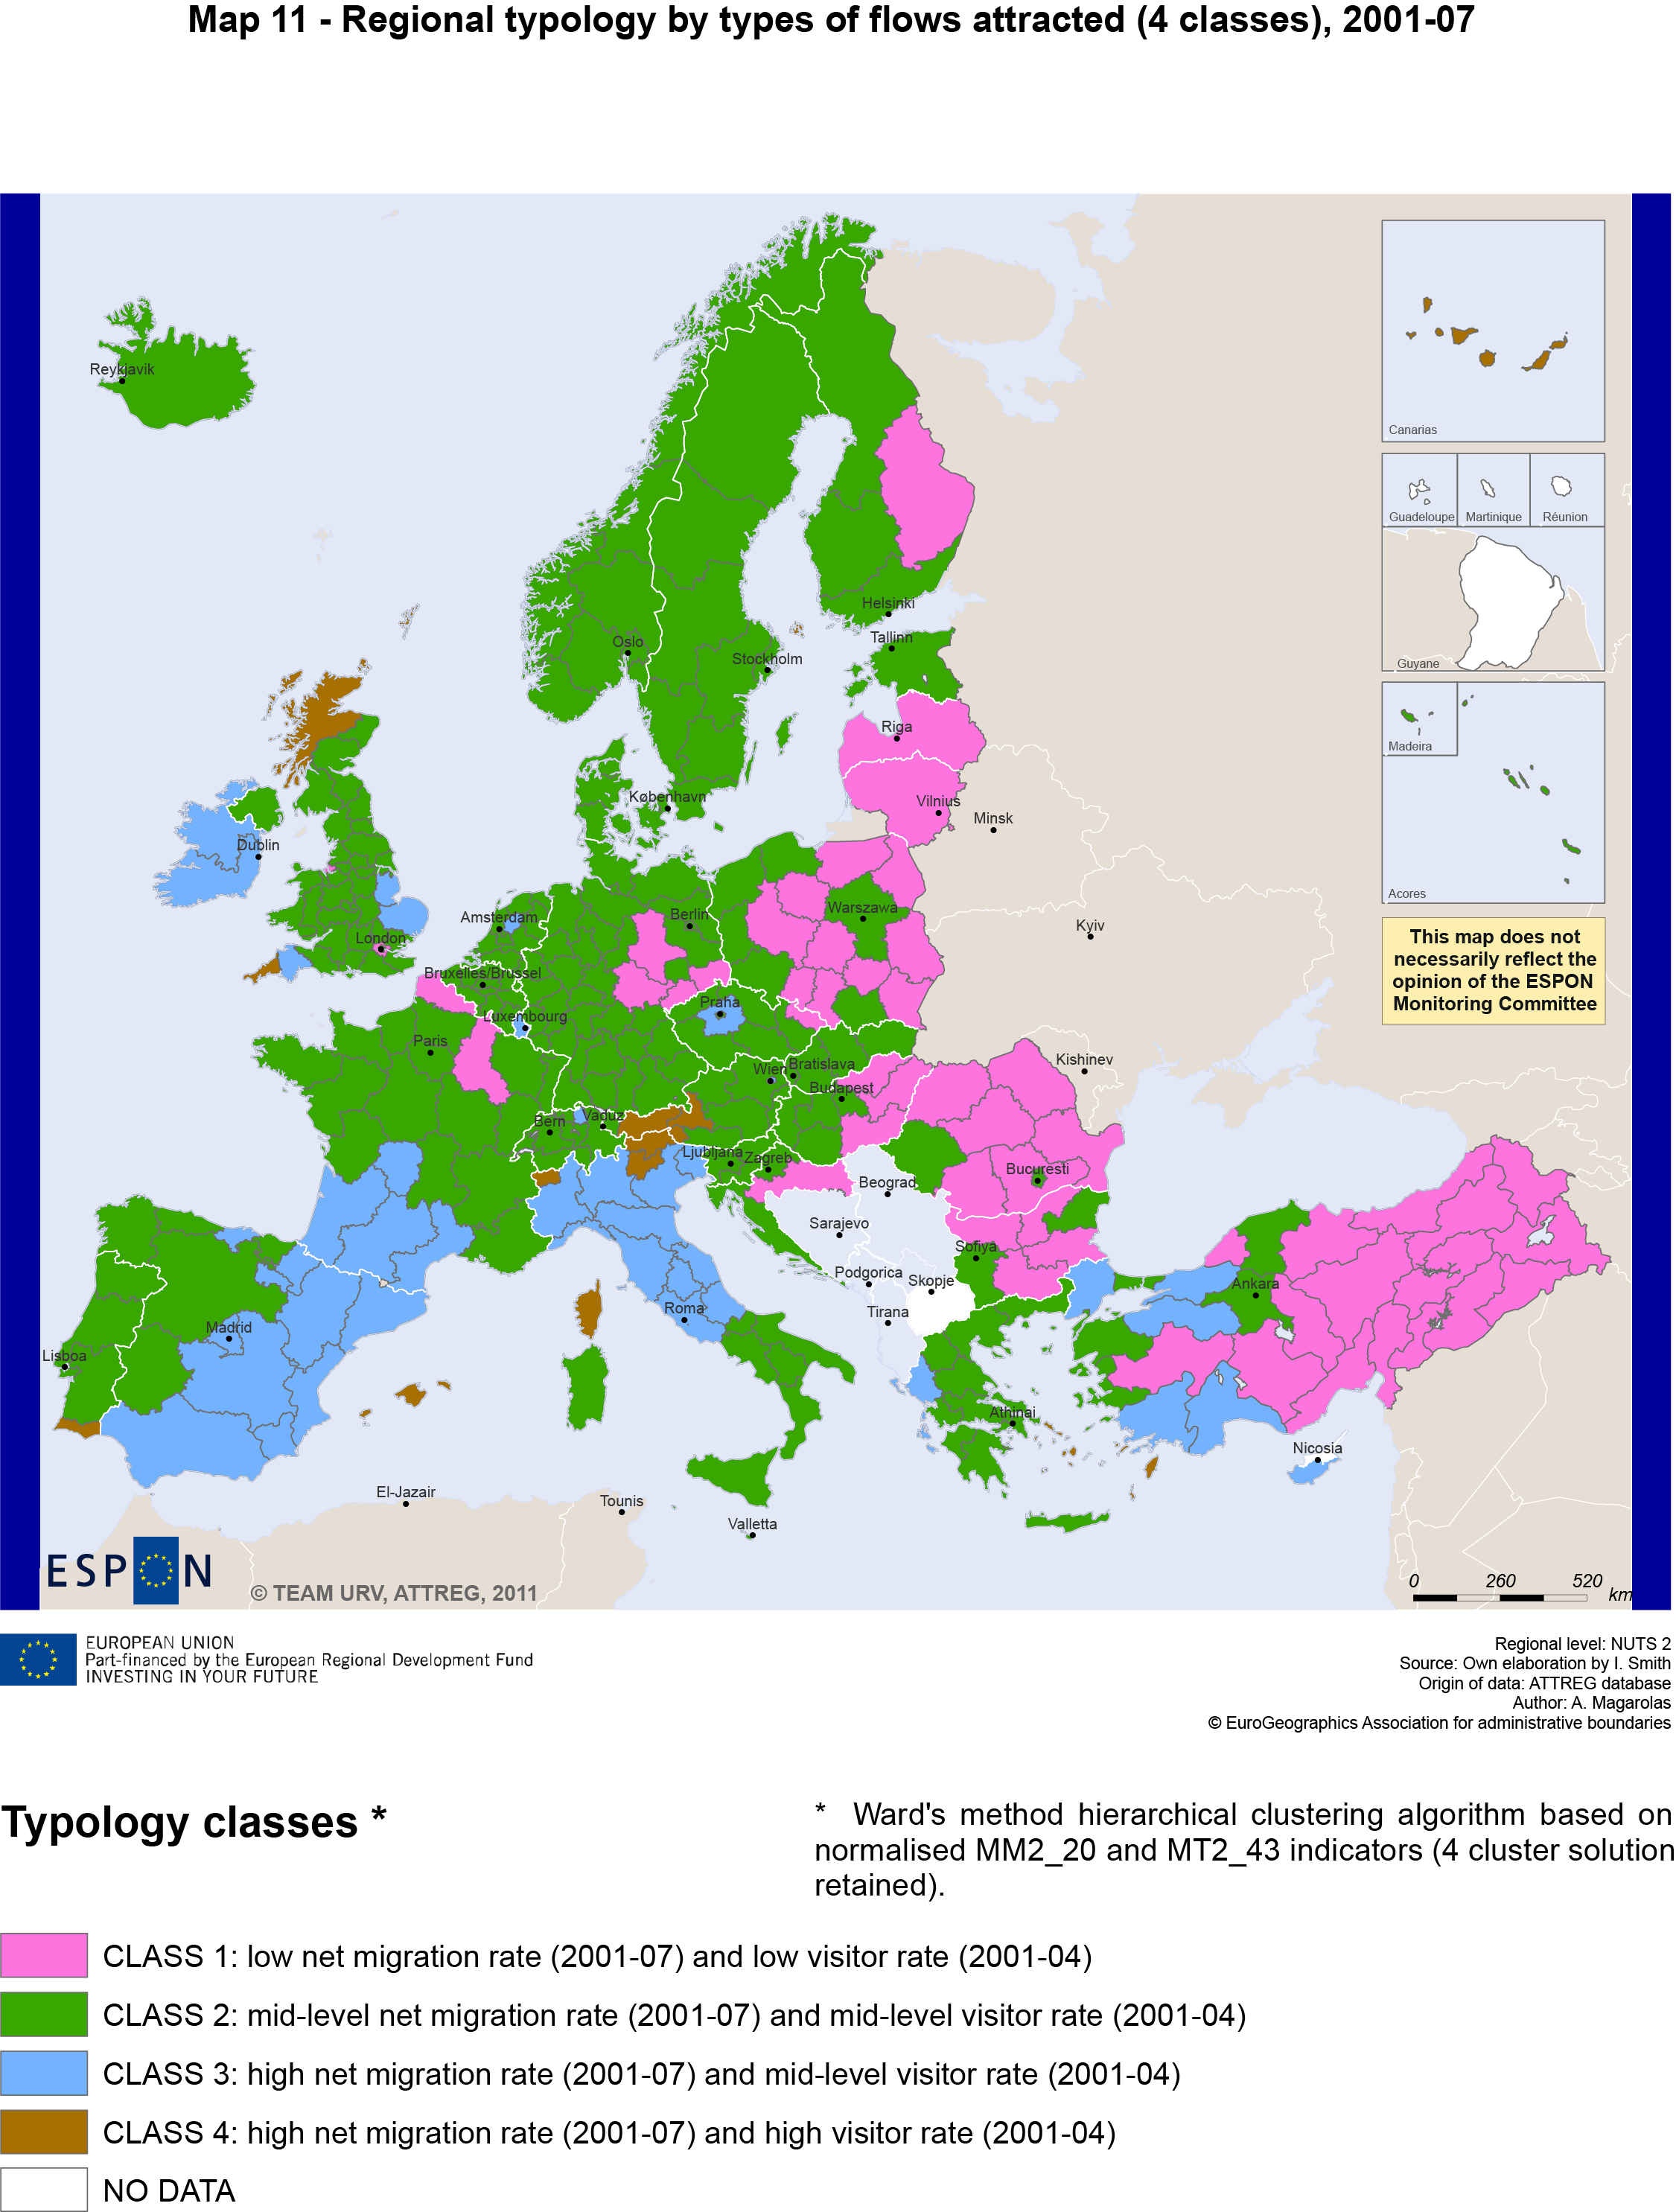
The map shows a regional typology of attractiveness based on the latest data available for two mobility indicators: annual average net migration rate (2001‐2007) and average annual visitor arrival rate (for visitors both domiciled within the country and domiciled abroad) (2001‐2004).
Points for policy consideration
- In the attempts to attract human capital, economic condition is not the only factor. Less attractive regions generally record lower rates of GDP per capita and higher rates of unemployment amongst workers with fewer qualifications. But an attractive region does not necessarily equate to a wealthy region in purely economic terms. And given the general relationship between visitor arrival rates and net-migration, it appears that opening up a region to tourism could also be an important step towards attracting people as residents (or indeed attracting people back as return migrants).
- It is one matter to attract human capital but quite another to capitalise on it to generate ongoing sustainable rates of growth. For example, in-migrants with high-level qualifications may be underemployed in low-skilled jobs thus under-utilising a valuable human resource. Regions that depend on these in-migrants to underpin growth yet do not adequately integrate them can harm their own resilience. Understanding the profile and needs of in-migrants is a first step. Supporting them to progress towards their career aspirations contribute to individual, regional and European growth.
- Outmigration of working age people from rural territories within the less attractive regions of eastern Europe, and north east France cannot plausibly be considered as a long term economic process for less attractive regions. Long term on-going net out migration will threaten the economic base for essential (public and private) services to communities and community sustainability overall although in the shorter term it may be considered a useful adjustment mechanism.
- Regardless of a territory’s current strengths and weaknesses, an integrated place-based approach is generally required to build a better understanding of the groups being attracted and to ensure there are economic opportunities for individuals. Place-based actions can take in themes such as providing a supportive environment for starting or developing business, connectivity/transport, quality affordable housing, skills development and fostering innovation.
- There is significant potential to address European-level disparities between eastern (relatively less attractive) and western Europe (relatively more attractive) to create a more balanced European territory based on programmes to build attractiveness. The ATTREG research suggests that regional policy-makers might look to building university capacity, increasing levels of qualifications in the workforce, increasing the life satisfaction of their inhabitants and increasing the tourism offer in making their region more attractive to inter-regional movers.
- In addition within eastern countries, tackling ongoing territorial concentration within individual national systems may be important given the dominant issue of capital city primacy. Evidence from the ESPON project Secondary Growth Poles identifies that adopting national de-concentration policies can deliver a ‘win win’ - growth outside of capital cities and boost national economic performance overall.
Observations
The map suggests that in general European regions that experience higher rates of net in-migration are also likely to experience higher visitor arrival rates. The regional characteristics that are associated with attracting either specific types of visitor or specific age groups of migrant are broader than purely economic factors extending to amenity value, heritage and accessibility as part of a basket of factors of attractiveness. Factors such as age and origin or visitors/migrants are important also.
The regions marked in pink experienced either net out-migration or very low levels of net in-migration combined with low visitor arrival rates for this time period. This group of regions record relatively low levels of GDP per capita and lower employment rates than regions in the rest of Europe. This sweep of regions from Latvia through the eastern boundary of the European Union and including much of Eastern Turkey (with the notable exception of the capital city regions) might be considered as relatively unattractive as destination regions during the time period of 2001-07. Despite this, these are regions where economic output (measured as GDP per capita) has grown strongly over the same period.
For these regions, exporting labour is unlikely to be a long term regional development strategy. These regions may want to confront the relatively poor prospects offered to either retain residents or to attract in-migrants. As a first step, it may also be helpful to explore why their current visitor offering has had a limited uptake.
The on-going relative attractiveness of capital city regions in Eastern-Central Europe (Warsaw, Bucharest, Sofia, Budapest) reflects the on-going heavy geographic concentration tendencies (of both economic function and job opportunities) within some eastern European countries.
National studies have shown that the loss of working age population within new member state territories (regions marked in ‘pink’) has benefitted other EU countries, especially the UK and Ireland. In particular, UK research shows that rural territories such as Lincolnshire and East Anglia (both marked in blue as regional ‘attractors’) benefitted from this. At the time of the enlargement of the EU in 2004, the UK (through a registration scheme), Ireland, Sweden were the only countries that allowed unrestricted entry to their labour markets to residents of these accession states.
The blue and brown regions demonstrate high levels of both higher levels of net in-migration and visitor arrival rates than the green and pink regions. Such high levels of net in-migration are normally seen as positive in an ageing EU. But it may possibly be problematic over the longer term (of the economic cycle) where national and regional policy-makers no longer recognise the need to integrate new-comers.
The research has indicated that amongst the (stronger destination) regions marked in green, blue and brown, there is no clear relationship with wealth in terms of GDP per capita and the tightness of the labour market (recorded as employment rate). Thus having a ‘higher value’ economy does not necessarily mean higher levels of net in-migration and visitor arrival rates. Outside of the group of ‘less attractive’ regions, regional attractiveness becomes associated with environmental amenity (milder winters), good tourism offer and higher satisfaction with life (measured from attitude surveys) rather than only being a matter of economic wealth.
Concept / method / measurement
The map shows a regional typology of attractiveness based on the latest data available for two mobility indicators: annual average net migration rate (2001‐2007) and average annual visitor arrival rate (for visitors both domiciled within the country and domiciled abroad) (2001‐2004).
As indicator of (observed) attractiveness the annual average net migration rate and average annual visitor arrival rate (for visitors both domiciled within the country and domiciled abroad) were combined using a clustering algorithm. The visitor data was collected at NUTS 2 level from Eurostat and the net-migration rate was calculated on the basis of a residual population model based on demographic data on births and deaths NUTS 2 level from Eurostat (derived from the earlier ESPON funded DEMIFER project). Data for Turkey were supplemented from the Turkish Statistical Institute.
In order to combine the two indicators: net migration with annual visitor rate, the technique of a hierarchical clustering algorithm was used in order to generate groupings of regions with similar characteristics for the chosen indicators of attractiveness. For the ATTREG project the clustering solutions for four and twelve groupings were retained. It is the solution for 4 clusters that is shown in the Map of the Month.
The hierarchical clustering algorithm (using Ward’s method) generates four clusters:
- Class 1 is made up of 54 NUTS2 regions (coloured pink in the map) where the average net migration rates over the period are either negative (there is net out-migration) or very small and positive, and combine with low to very low visitation rates;
- Class 2 is made up of 202 regions (in green in the map) where net migration rates are positive but small, and where net visitation rates are close to zero but generally greater than those in Class 1;
- Class 3 is a group of 43 regions (in blue in the map) with a range of net migration rates going from high to very high and a range of visitation rates similar to that of Class 2;
- Class 4 is a small group of 13 regions (in brown in the map) characterised by net migration rates which are generally high, and distinctively high visitation rates.
More
- Most of the information and data used are based on available results from the ESPON applied project “ATTREG - Attractiveness of European Regions and Cities for Residents and Visitors“
- Contact at the ESPON Coordination Unit: Kieran KEARNEY ([email protected])
___________________
(1) See ESPON Territorial Observation No 6: Regions and Cities in the World Economy
Documents

|
Attractiveness of Regions to Migrants and Visitors
|
|

|
Map "Attractiveness of Regions to Migrants and Visitors"
|
|

|
Map "Attractiveness of Regions to Migrants and Visitors"
|

